Systematic Review

Through a series of risk management meetings with our partner fire departments, we have identified the following list of potentially effective interventions to reduce emergency service vehicle crashes.

View the abstract of the systematic review online: "Interventions and controls to prevent emergency service vehicle incidents: A mixed methods review" or download the PDF.

Improving Driving Simulator Use

Improving Driving Simulator Use

Driving simulators may be used to supplement hands on driving. Specific scenarios/situations may be drilled with simulators. To increase use of simulators, certain techniques can be applied to reduce simulator sickness.

Simulator

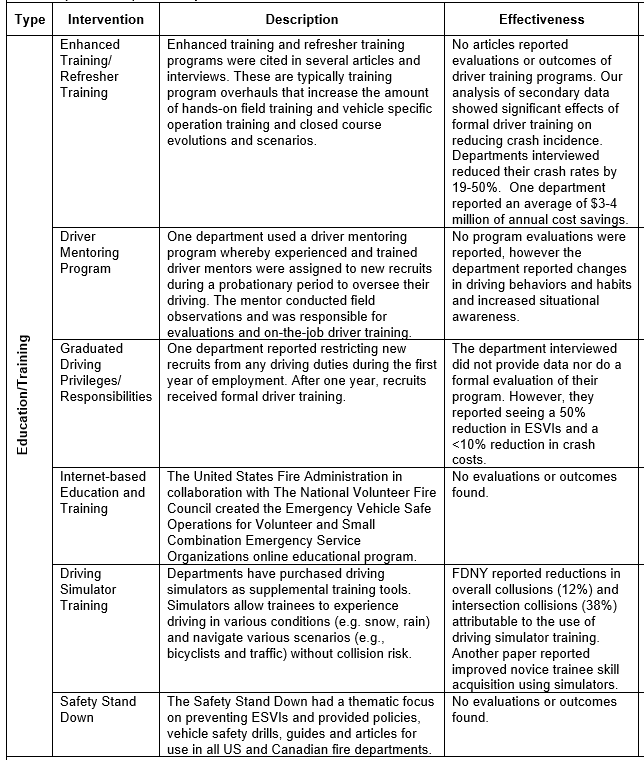
  • FDNY reported that all accidents (firefighter vehicle) were reduced by 12% and intersection collisions by 38%. (Raheb, 2005).
  • California Commission on Peace Officer Standards and Training reported that blended training (hands on and simulator training) resulted in fewest collisions for peace officers; though no data are available to substantiate this claim (Trench, 2010).
  • Gradual exposure (acclimation) to simulator training shown to reduce self-reported simulator sickness symptoms (N=120) (Domeyer, 2013).
  • Use of optical corrective lenses (to correct the discrepancy between virtual distance and actual screen distance) shown to reduce simulator sickness symptoms when compared to controls and placebo (non-corrective lenses) (Bridgeman, 2014)
  • Use of ‘relaxing music’ reduced the severity of reported simulator sickness (N=93); simulation was a bicycle video and may not be applicable to driving (Keshavarz, 2014). 
  • Use of pleasant odors (e.g. rose) may reduce severity of reported simulator sickness (N=42) (Keshavarz, 2015) 
  • Simulator sickness symptoms may occur after simulator use (delayed onset) and could pose a risk to actual driving (Brooks, 2010).
  • Study conducted by The California Commission on Peace Officer Standards and Training (POST) found that use of computer simulators results in the fewest collisions.
  • Miami-Dade Fire Department reportedly has reduced simulator sickness to ~3% of trainees.

Range of Costs

Varying

Sources

  • Bridgeman, B., Blaesi, S., and Campusano R., 2014. Optical correction reduces simulator sickness in a driving environment. Hum Factors 56(8): 1472-1481.
  • Brooks, J. O., Goodenough, R. R., Crisler, M. C., Klein, N. D., Alley, R. L., Koon, B. L., Logan, W. C., Ogle, J. H., Tyrrell, R. A., and Wills, R. F., 2010. Simulator sickness during driving simulation studies. Accident Analysis & Prevention 42(3): 788-7
  • Domeyer, J. E., Cassavaugh, N. D., and Backs, R. W., 2013. The use of adaptation to reduce simulator sickness in driving assessment and research. Accid Anal Prev 53: 127-132.
  • Keshavarz, B. and Hecht, H., 2014. Pleasant music as a countermeasure against visually induced motion sickness. Appl Ergon 45(3): 521-527.
  • Keshavarz, B., Stelzmann, D., Paillard, A., Hecht, H., 2015. Visually induced motion sickness can be alleviated by pleasant odors. Exp Brain Res 233(5): 1353-1364.
  • Raheb, R. (2005). Simulating emergency vehicle training. Emerg Med Serv 34(8): 74, 76, 79.
  • Trench, N., Wieder, M. A., Janing, J., Parker, C., and Robinson, C., 2014. Emergency Vehicle Safety Initiative, United States Fire Administration 1-160.

Emergency Vehicle Pre-Emption

Emergency Vehicle Pre-Emption

Pre-emption systems utilize on-vehicle signal emitters that trigger receivers built into traffic signals to switch the traffic light in the direction of travel to green while switching opposing and cross-traffic lights red, permitting priority passage of the emergency vehicle and stopping cross traffic.

According to FHWA studies, implementation of Opticom systems:

  • Reduce intersection crash rates by up to 70% (this is for all emergency vehicle crashes)].
  • Improve response times by up to 25%.
  • Eliminate priority conflict
  • Receive data reports logging vehicles and preemption activity
    City of St. Paul Minnesota saw emergency vehicle accidents at intersections drop by 70.8% after using Opticom since 1969. (Hudson, 2003)
  • Data from PWC suggests Opticom had minimal if any effect on reducing crashes, though call volume/mileage could not be estimated.

Range of Costs

$150,000+

Data

Studies reported small, but significant reductions in response times and traffic flow. However, no study we reviewed evaluated or reported reductions in crash incidence or crash risk. Our analysis of secondary data showed no significant changes to intersection crash risk after adoption of pre-emption

Sources

  • Afdhal and Elizar, 2015. Enhanced route guidance and navigation for emergency vehicle using V2I-based cooperative communication. In: Proceedings of the Electronics Symposium (IES), 2015 International, pp. 145-150.
  • Eltayeb, A.S., Almubarak, H.O., Attia, T.A., Year. A GPS based traffic light pre-emption control system for emergency vehicles. In: Proceedings of the Computing, Electrical and Electronics Engineering (ICCEEE), 2013 International Conference on, pp. 724-72
  • McGowan, D.R., 2014. Safety on the streets. J Emergen Med Serv Suppl, 10-2.
  • Pei-Hsuan, L., Tsung-Chuan, H., Year. A geocasting application for ambulance service. In: Proceedings of the Computing, Networking and Communications (ICNC), 2014 International Conference on, pp. 1086-1090.
  • Shankar, V., Gautham, R., Vedaprakashvarma, Year. Automated traffic signal for hassle free movement of ambulance. In: Proceedings of the Electrical, Computer and Communication Technologies (ICECCT), 2015 IEEE International Conference on, pp. 1-5.
  • Tokuda, K., Ohmori, S., Year. Demonstration experiments of SAFER (Speedy Ambulance First-aid, Emergency, Rescue operations supporting) system. In: Proceedings of the Wireless Personal Multimedia Communications (WPMC), 2011 14th International Symposium on.
  • Tonguz, O.K., Viriyasitavat, W., 2016. A self-organizing network approach to priority management at intersections. IEEE Commun Mag 54 (6), 119-127.
  • Vemuri, M., Mande, U., Year. An Effective Hybrid Model for Expert Traffic Control System. In: Proceedings of the Computational Intelligence and Communication Networks (CICN), 2014 International Conference on, pp. 1145-1147.
  • Wang, Y.S., Wu, Z.Z., Yang, X.G., Huang, L.Y., 2013. Design and Implementation of an Emergency Vehicle Signal Preemption System Based on Cooperative Vehicle-Infrastructure Technology. Adv Mech Eng, 5, 834976.

Road Safety by Zoll

Road Safety by Zoll

Zoll Road Safety Systems use audible warnings to modify driver behaviors. The audible warnings increase in intensity based on the level of driver violation (i.e. sound gets louder the longer someone speeds). System also includes GPS tracking and reporting of violations. Primarily used in ambulances.

According to Zoll: 

  • 87% decrease in preventable accidents (emergency vehicle accidents)
  • 3 million miles without an injury accident (emergency vehicle accidents)
  • 60% reduction in collisions (emergency vehicle (related) collisions

Range of Costs

$5,000/unit

Sources

  • Road Safety Management System from Zoll Brochure

Driver Training

Driver Training

NFPA 1002 identified minimum job performance requirements for drivers and vehicle operators. Improving drivers training is prioritized and should contribute to safer vehicle operations. 

According to NIOSH’s Fire Fighter Fatality Investigation and Prevention Program (FFFIPP):

  • 29.3%of fire departments provide training to firefighters as per FFFIPP recommendations.
  • 78.8% of fire departments have Standard Operating Procedures (SOPs) in place consistent with the FFFIPP recommendations.
  • The FFFIPP study found that departments which have experienced fatality are more eager to train firefighters and develop SOPs.
  • In civilian drivers (N=309,624) there is little evidence to suggest, post-license driver training (remedial and advanced training) alone may reduce crash or injury rates; but training may reduce the rate of traffic offenses (Ker, 2003).

Range of Costs

Variable

Data

Sources

  • Dow, P., 2007. Increasing Your Drivers' Safety Awareness. Fire Engineering 160 (2), 69-74.
  • Goldfeder, B., 2006. It's as simple as wearing your seatbelt: use the National Firefighter Safety Stand Down to fix some of the issues of firefighter survival. FireRescue Magazine 24 (5), 72-74 3p.
  • Ker, K., I. Roberts, T. Collier, F. Renton and F. Bunn, 2003. Post-licence driver education for the prevention of road traffic crashes. Cochrane Database Syst Rev (3): Cd003734.
  • Lindsey, J.T., Barron, A.E., 2008. Effects of simulation on emergency vehicle drivers' competency in training. Prehosp Disaster Med 23 (4), 361-8.
  • McRoy, B.S., Lawrence, R., 2014. How to build the crew chain of safety. Safe driving is a priority for Richmond Ambulance Authority crews. EMS World 43 (4), 26-8, 30, 32-6.
  • Nordberg, M., 2006. Driving online. Internet-based program for emergency vehicle safe operations now available. Emerg Med Serv 35 (1), 40.
  • Raheb, R., 2005. Simulating emergency vehicle training. Emergency Medical Services 34 (8), 74-79 3p.

Five Point Harness and Seatbelt Use

Five Point Harness and Seatbelt Use

Seatbelt use is mandated in all departments, but compliance is generally low due to large turnout gear making buckling in difficult. Products like ReadyReach place buckles in easy to reach locations and extend seatbelt stalks for ease of access in large turnout gear. Bright orange webbing makes seatbelts easy to see. (IMMI, 2015)

  • Although 84% of fire departments require firefighters to wear seat belts while in emergency vehicles, 16% of fire departments do not require seat belt usage according to NIOSH’s Fire Fighter Fatality Investigation and Prevention Program (FFFIPP). The investigation found that fire departments which have had fire fighter fatality are more likely to require seat belt use. Fire departments in the Midwest are the least likely to comply with seat belt recommendations while fire departments in the western region of the nation have shown the greatest compliance in requiring the use of seat belts.
  • The entire FDNY fleet is outfitted with IMMI’s ReadyReach though no effectiveness data are available (IMMI, 2015)
  • Multi-pronged approaches to seatbelt compliance are most effective, and the use of incentives (cash or otherwise) and obtrusive observations and feedback in occupational settings have been shown to increase seat belt usage 50-100% (Segui-Gomez, 2000).
  • According to the the “Emergency Service Vehicle Safety Initiative” by FEMA, vehicle occupant fatalities during the daytime decreased from 57% in 1994 to 44% in 2009. 
  • Five-point harness seat restraints have been used in apparatuses and ambulances to improve mobility while seated and increase vehicle restraint use. 
    • Articles reviewed did not evaluate usage or other outcomes, but noted enthusiasm and high acceptability among emergency services personnel. 
  • Several articles discussed the use of seatbelt pledges to increase seatbelt compliance in the fire service. 
    • No formal evaluations or outcomes found. None of the articles reviewed reported any changes to seatbelt compliance or use. 

Range of Costs

Variable

Sources

  • Bellace, L., 2012. How we built a better ambulance. EMS World 41 (10), 62-6.
  • Fontenot, K., 2011a. It's Time to STOP For First Responder Safety. Firehouse 36 (5), 78-80 3p.
  • IMMI. ReadyReach. Available at: http://www.imminet.com/products/fire-ems/readyreach/. Accessed March 10, 2015.
  • Ludwig, G., 2008. Time to belt up! A pledge to protect our own lives. Journal of Emergency Medical Services 33 (1), 32.
  • Nordberg, M., 2006. In Winter Park, employee safety comes first. Emergency Medical Services 35 (6), 79-79 1p.
  • Segui-Gomez, M. (2000). "Evaluating worksite-based interventions that promote safety belt use." American Journal of Preventive Medicine 18(4, Supplement 1): 11-22.

Proactive Risk Management/ Risk Assessment

Proactive Risk Management/ Risk Assessment

  • Proactive risk management utilizes a formalized procedure of identifying, evaluating and ranking risks, and implementing controls. This has been implemented in various industries to prevent and reduce occupational risks and hazards. Some departments also use formal and informal risk assessment to identify root causes of collisions. 
  • Several departments have reported using crash review boards as a component of their safety programs. The review board members generally use sessions to identify causes of crashes and make recommendations for remedial training or discipline. 

Data

Articles we reviewed reported a 58% reduction in ESVIs, 54% reduction in related costs and 36% reduction in crash related injuries. Data provided by one department we interviewed revealed a 19% reduction in overall crash rates. 

Sources

  • Ludwig, G., 2013. Ambulance safety. Seeking a system to analyze & prevent emergency vehicle crashes. Journal of Emergency Medical Services 38 (7), 24.
  • McRoy, B.S., Lawrence, R., 2014. How to build the crew chain of safety. Safe driving is a priority for Richmond Ambulance Authority crews. EMS World 43 (4), 26-8, 30, 32-6.
  • Mund, E., 2010. Developing a safety culture. Rockland Paramedic Services is serious about safety. EMS World 39 (10), S6-7.
  • Shiring, P., 2007. Safety A.S.A.P. The Ambulance Safety Awareness Program at Baldwin EMS. Journal of Emergency Medical Services 32 (9), 54-8.

Develop and Implement Emergency Response Policies

Develop and Implement Emergency Response Policies

It has been identified that certain calls (e.g. reset fire alarms, invalid assists) may not require emergency (i.e. lights and sirens, or code 3) responses. Reducing the amount of emergency response calls may reduce exposure to high risk driving conditions and lower crash rates.

  • The St. Louis Fire Department saw a 35% reduction in ESVCs after implementation of an “On the Quiet” program aimed to reduce siren use and consequently vehicular speeds for non-emergency calls, and Salt Lake City also saw a 78% reduction in ESVCs after implementation of a similar policy (Williams, 2005)


Sources

  • Williams AS. (2005) Identifying Issues When Reporting Without Lights and Siren to Selected Call Types for the Anne Arundel County Fire Department. USFA. Dec 2005. www.usfa.fema.gov/pdf/efop/efo38659.pdf. Accessed 16 Feb 2014.

FSVO Certification

FSVO Certification

The Fire Service Vehicle Operator course is designed for Firefighters or Engineers who are assigned, or may be assigned, to operate fire department apparatus safely in the normal course of their duties. This course covers common driving hazards, vehicle maintenance and inspections, and driver’s training (Illinois Fire Service Institute, 2015).

  • No information on program effectiveness can be found. However, driver training is emphasized by NFPA and FEMA vehicle safety standards.
  • The online FSVO program trains to NFPA standards 1002, 1142, 1451 (Illinois Fire Service institute, 2015)

Sources

  • Illinois Fire Service Institute. Fire Service Vehicle Operator. Available at: http://www.fsi.illinois.edu/content/courses/programs/description.cfm?course_id=134. Accessed, March 10, 2015

Use of VDR data

Use of VDR data

These systems track vehicle movement and engine data, but do not have a video or audio recording component. Some have audible in-cab alerts to alert drivers to speeding or harsh braking. The most basic systems simply track driving data that can be reviewed by safety managers. Some systems are designed to include metrics for monitoring vehicle issues and scheduling regular maintenance and repairs. VDRs are required for heavy fire service vehicles to meet the NFPA 1901 Standard.

  • In an occupational setting of technical service truck drivers (N=191), the use of VDRs (tracking driver behaviors and providing feedback) has been shown to reduce all crashes by 38% and at fault crashes by 5%, 7 months after implementation; no data on long term effects (Toledo, 2008).
  • Non-randomized, matched control, trial (N=840) showed a 20% reduction in crash rates (range = -31% to -12%) over a one year period on a broad range of vehicles used in occupational settings (light passenger taxis to heavy transport trucks—no emergency vehicles); again, long term benefits are unknown (Wouters, 2000).

Range of Costs

$30 - $5,000 per vehicle

Data

Black box devices with audible in-cab alerts had significant reductions in unwanted driving behaviors (e.g. speeding) and reduced ESVIs among EMS drivers. Most studies reported behavioral outcomes related to significant reductions in unwanted driving behaviors. Vendors of certain systems reported significant annual cost savings due to vehicle repair and crash costs. Two articles reported reductions between 80-95% in ESVIs attributable to these systems.

Sources

  • Barishansky, R.M., O'Connor, K., 2007. Best practices for EMS: who's found a better way of doing things, and how can you benefit too? Emergency Medical Services 36 (1), 71-74 4p.
  • Erich, J., 2009. Driver training: balancing the best of both worlds. EMS Magazine 38 (3), 67-70 3p.
  • Harden, A.M., 2012. Smart tracking: innovative vehicle programs decrease errors & increase efficiency. Journal of Emergency Medical Services 37 (12), 52-4.
  • Levick, N.R., Swanson, J., 2005. An optimal solution for enhancing ambulance safety: implementing a driver performance feedback and monitoring device in ground emergency medical service vehicles. Annual proceedings / Association for the Advancement of Aut
  • McGowan, D.R., 2014. Safety on the streets. Journal of Emergency Medical Services Suppl, 10-2.
  • McRoy, B.S., Lawrence, R., 2014. How to build the crew chain of safety. Safe driving is a priority for Richmond Ambulance Authority crews. EMS World 43 (4), 26-8, 30, 32-6.
  • Nordberg, M., 2010. Why you need a big brother. Black box technology is enhancing driver safely in EMS. EMS World 39 (10), S16-7.
  • Robyn, K., 2006. Meet a friendly big brother. Richmond Ambulance Authority pairs black box recorders with wireless data transfer. Emerg Med Serv 35 (2), 34.
  • Toledo, T., Musicant, O. and Lotan T., 2008. In-vehicle data recorders for monitoring and feedback on drivers' behavior. Transportation Research Part C-Emerging Technologies 16(3): 320-331.
  • Wouters, P. I. J. and Bos, J. M. J., 2000. Traffic accident reduction by monitoring driver behaviour with in-car data recorders. Accident Analysis and Prevention 32(5): 643-650.

Rear View Cameras

Rear View Cameras

Rear facing cameras used to display a live image of potential hazards and objects to the rear of a vehicle. Some advanced systems include sonar/radar to alert drivers of potential objects with audible distance indicators.

  • In non-randomized controlled trial (N=46; civilians), 88% of test group did not have crash, while 100% of controls crashed; actual use of cameras (looking at screen) was low among test group (about 20%), though use of an audible back up alarm may help increase more consistent use (Hurwitz, 2010)
  • Insurance Institute for Highway Safety (IIHS) saw a 43% reduction in pedestrian backing crashes (dummy pedestrian) in volunteer SUV drivers (N=111); backing sensors (alone or with cameras) were not more effective than cameras alone (Kidd, 2014).
  • Back up cameras reduce rear blind zones (area not visible with side mirrors) by up to 90% in passenger vehicles (Kidd, 2014b)
  • NHTSA has mandated that all new passenger vehicles to be equipped with rear view cameras by 2018
  • Departments interviewed estimated a <10% reduction in backing incidents after installing backup cameras in department vehicles. 

Range of Costs

$300 - $900 per vehicle

Sources

  • Hurwitz, D. S., et al. 2010. Backing collisions: a study of drivers' eye and backing behaviour using combined rear-view camera and sensor systems. Injury Prevention, 16(2): 7.
  • Kidd, D. G. and Brethwaite, A., 2014. Visibility of children behind 2010–2013 model year passenger vehicles using glances, mirrors, and backup cameras and parking sensors. Accident Analysis & Prevention 66(0): 158-167.
  • Kidd, D. G., Hagoski, B. K., Tucker, T. G. and Chiang, D. P., 2014. The Effectiveness of a Rearview Camera and Parking Sensor System Alone and Combined for Preventing a Collision With an Unexpected Stationary or Moving Object. Human Factors 57(4): 689-700

Wireless Headsets for Driver and Spotter

Wireless Headsets for Driver and Spotter

Primarily used for hearing protection and increased on scene communications. May be used to enhance communication between drivers and spotters.

  • The use of both wired and wireless headsets for spotter-to-driver communication is often recommended. 
    • No evaluations or outcomes were found.  

Range of Costs

Low: $1500 (Paired units) Med: $3000 (2 crew set) High: $5000 (4 crew set)

Sources

  • Laura Pittkin, SetComCorp, Personal Communication, 2015
  • Wilbur, M., 2010. Technology aids apparatus backing. Firehouse 35 (11), 122-123 2p.

Audible Backing Sensor Alarm

Audible Backing Sensor Alarm

These systems provide audible warnings to drivers approaching foreign objects while backing.

  • Backing sensor alarms alone were found to be less effective than back up cameras alone; backup cameras plus sensor systems were less effective than back up cameras alone (Kidd, 2014).

Range of Costs

$200 - $400 / vehicle

Sources

  • Kidd, D. G., et al. (2014). "The Effectiveness of a Rearview Camera and Parking Sensor System Alone and Combined for Preventing a Collision With an Unexpected Stationary or Moving Object." The Journal of the Human Factors
  • Rosco Vision Systems. Our Products. Available at: https://www.roscovision.com/our-products/backup-camera-systems. Accessed March 10, 2015

NFPA Reflective Markings

NFPA Reflective Markings

Reflective markings on apparatuses increase vehicle conspicuity and may reduce roadside collisions.

  • 15% reduction in accidents for trucks with retro reflectors, versus those without. (Olson et al., 1992)
  • 1999 United Kingdom study found that fully outlining (large) vehicles with contour markings increased surrounding drivers’ ability to detect them both day and night, as well as judge their size and distance.

Range of Costs

Varying

Blocking SOP for Roadways

Blocking SOP for Roadways

Various policies and procedures have been outlined for effective on scene blocking to reduce on-scene roadside collisions. Examples of policies include always dispatching two vehicles and using one for blocking, assigning spotters to watch and direct oncoming traffic, and deploying roadside flares.  

  • NIOSH recommends that more detailed blocking SOPs be implemented to reduce emergency vehicle accidents.
  • SOPs enable agencies and their personnel to operate in an efficient and constructive manner. Enforcing and developing SOPs related to roadway incident scene operations as well as emergency vehicle response procedures reduce the risk of collisions.

Range of Costs

Personnel Time.

Sources

  • Salka, J.J., Jr., 2010. On the road again. Firehouse 35 (5), 118-118 1p.

Drive Cam

Drive Cam

DriveCam is an on-board event recording system which has been implemented in ambulances in several departments. The DriveCam system captures 12 second video clips of the inner vehicle cabin and forward street view when there is a sudden and significant change in longitudinal or latitudinal g-force (e.g., hard braking, hard acceleration, hard cornering or collision). Video clips are reviewed by trained analysts for driving issues.  

Data

No articles reviewed report that DriveCam is effective in reducing ESVIs. Several articles, suggest DriveCam may reduce vehicle incident costs (repairs and claims). Most studies report changes to driver behaviors (e.g. rate of breaking defined driving rules) documented by the DriveCam system. Data from departments revealed that DriveCam reduced the amount of ESVI legal claim payouts; however, no reduction in overall crash rates was observed. Lytx, the DriveCam parent company, has reported crash reductions between 30-90%.

Sources

  • Devlin, J., 2010. The impact of in-vehicle video cameras on unwanted driver behavior. Executive Fire Officer Program Applied Research Project. National Fire Academy, Emmitsburg, MD, pp. 37.
  • Erich, J., 2007b. Rules of the road. The must-haves of an effective vehicle-safety program. EMS Magazine 36 (6), 69-73, 75-8.
  • JE, 2005. EMS Union wary as FDNY starts DriveCam Pilot Program. EMS World 34 (6), 56-56 1p.
  • Lindstrom, A., 2006. Priority traffic. Insurance discounts for demonstrable safety. Journal of Emergency Medical Services 31 (2), 25-26 2p.
  • Myers, L.A., Russi, C.S., Will, M.D., Hankins, D.G., 2012. Effect of an onboard event recorder and a formal review process on ambulance driving behaviour. Emerg Med J 29 (2), 133-5.

Advanced Warning Devices (in-cab civilian alerts)

Advanced Warning Devices (in-cab civilian alerts)

These systems focus on increasing the time to saliency (noticeability) of emergency service vehicles operating with lights and sirens among civilian drivers. Studies included advanced warnings to identify optimal timing of alerts and one study was a pilot demonstration. 

Data

All studies reported significant reductions in time-to-saliency, increased distance at point of saliency, and improved driver braking (as opposed to slamming on brakes). In one simulation study, the risk of collision with an ESV was significantly lower by 60% in the advanced warning group compared to controls. 

Sources

  • Drucker, C.J., 2014. An epidemiological approach to emergency vehicle advanced warning system development: A two-phase study. ProQuest Information & Learning.
  • Finucane, M.C., 2010. Vehicle detection: new technology aims to inform the public about emergency vehicle. EMS Magazine 39 (3), 58-59 2p.
  • Lenné, M.G., Triggs, T.J., Mulvihill, C.M., Regan, M.A., Corben, B.F., 2008. Detection of emergency vehicles: driver responses to advance warning in a driving simulator. Human Factors 50 (1), 135-144 10p.

Enhancing Efficacy of Lights and Sirens

Enhancing Efficacy of Lights and Sirens

  • One study evaluated various light bar configurations (frequency and flash patterns) to identify optimal settings for vehicle conspicuity and saliency. One study evaluated siren frequencies to identify optimal frequencies.
    • 4 Hz frequencies were rated more urgent than 1 Hz. The siren study reported significant reductions in transportation times when using the experimental siren. 
  • Several articles and departments reported the use of policies to modify Code 3 response protocols to reduce the use of unnecessary emergency lights and sirens when crash risk is generally elevated.
    • A modified Code 3 SOP at FDNY resulted in a reported 32% reduction in crashes. Similar results were found in other departments, with reductions between 10-78% reductions in crashes reported.
  • One study reported the development of an algorithm using field indicators to determine if a lights and siren dispatch was warranted for vehicle crash incidents. 
    • The dispatch algorithm was 97% sensitive and 33% specific in identifying incidents where patients required prompt trauma care. 

Sources

  • Catchpole, K., McKeown, D., 2007. A framework for the design of ambulance sirens. Ergonomics 50 (8), 1287-301.
  • Isenberg, D., Cone, D.C., Stiell, I.G., 2012. A simple three-step dispatch rule may reduce lights and sirens responses to motor vehicle crashes. Emergency Medicine Journal 29 (7), 592-595 4p.
  • JEMS Staff, 2013. Sea change. Three key factors revolutionizing EMS. Journal of Emergency Medical Services 38 (10), 32.
  • Lindstrom, A.-M., 2011. Priority traffic. Less use of lights & sirens. Journal of Emergency Medical Services 36 (6), 26-26 1p.
  • Trench, N., Wieder, M.A., Janing, J., Parker, C., Robinson, C., 2014. Emergency Vehicle Safety Initiative. United States Fire Administration pp. 1-160.
  • Turner, S., Wylde, J., Langham, M., Morrow, A., 2014. Determining optimum flash patterns for emergency service vehicles: an experimental investigation using high definition film. Appl Ergon 45 (5), 1313-9.
  • Wilbur, M., 2011. Good News: Line-of-Duty Deaths Down in 2010. Firehouse 36 (3), 114-116 3p.

Crew Resource Management (CRM)

Crew Resource Management (CRM)

CRM was developed in the 1970s by NASA to reduce human error and increase safety during flight operations. One of the core tenets of the system is redundant and multi-person verification of critical actions to catch and reduce the risk of errors. This can be applied in emergency vehicle operations by having both driver and officer verbally verify intersection cross traffic is clear or not.

  • Though not formally evaluated, there are near miss case reports demonstrating the use of CRM in preventing imminent collisions in fire apparatuses.

Several articles cited lack of accountability and discipline for driving SOP violations as contributing to lax safety cultures and recommended strict enforcement of disciplinary policies as a countermeasure. Some articles recommended holding both driver and officer accountable for all vehicle incidents with discipline including suspension, remedial training, termination or fines. One key informant implemented a seatbelt policy with clearly defined disciplinary measures for non-compliance.

  • No evidence was found that increased discipline and accountability reduced crash risks. The one department that implemented a seatbelt policy with discipline reported (but did not provide data) an over 50% increase in seatbelt usage.


Sources

  • Ellis, D., 2006. From the air to the ground: air medical safety practices applied to ground critical care. Air Med J 25 (4), 158-9.
  • Erich, J., 2007b. Rules of the road. The must-haves of an effective vehicle-safety program. EMS Magazine 36 (6), 69-73, 75-8.
  • Fontenot, K., 2011b. Lack of SOPs + Lack of Discipline = LODDs. Firehouse 36 (3), 108-109 2p.
  • McRoy, B.S., Lawrence, R., 2014. How to build the crew chain of safety. Safe driving is a priority for Richmond Ambulance Authority crews. EMS World 43 (4), 26-8, 30, 32-6.
  • Sanddal, N.D., Albert, S., Hansen, J.D., Kupas, D.F., 2008. Contributing factors and issues associated with rural ambulance crashes: literature review and annotated bibliography. Prehospital Emergency Care 12 (2), 257-267 11p.
  • Slattery, D.E., Silver, A., 2009. The hazards of providing care in emergency vehicles: an opportunity for reform. Prehosp Emerg Care 13 (3), 388-97.
  • Tippett Jr, J.B., 2011. Near-miss reports. Be a backseat driver! All crewmembers riding in the apparatus must pay attention to the road. FireRescue Magazine 29 (2), 36-36 1p.